Csc 4330/6330, Programming Language Concepts (Spring 2018)
Hilbert Curves (Due: 29 April (Sunday))
Write a Prolog program (hilbert.pl) to draw "Hilbert Curves".Hilbert curves come in different sizes, starting at 0, and come in four varieties, H-curve, A-curve, B-curve, and C-curve. Hilbert curves of size 0 occupy no space. Hilbert curves of higher sizes are defined recursively as follows:
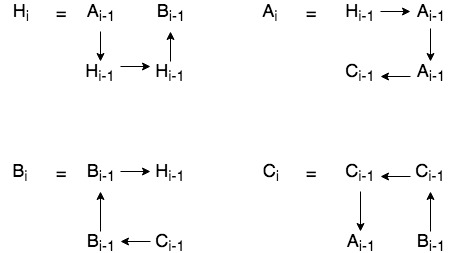
The arrows are shown for directional purposes, but in the actual curves, these do not contain the arrow. You may assume that each of these "arrow" segment is a straight line of 20 pixels. You can imagine drawing these curves by starting at a point on the canvas with a pen and continue to draw the curve without lifting the pen. Hilbert curves of size i are defined in terms of other curves of size i-1.
Your program should print H-curves of sizes 1 to 5. H-curves of various sizes are shown in the following links:
Size 1
Size 2
Size 3
Size 4
Size 5
Size 6
Implementation Hints
The printing of the curves will be done in two steps.STEP 1: In the first step, the program should produce a list of x-y coordinates, starting at (0,0), and progressing through all the line segments until the final segment. To record these coordinates, you will need a list structure that contains the coordinate list as well as the current position on the canvas. For example, at some point in the middle of the program, the list structure may contain:
Board = [[[60,0],[40,0],[40,20],[60,20]],60,0]This list contains 3 items: a list of coordinates so far and the current (x,y) coordinate. It will be helpful to write the following predicates:
goEast(BoardIn,BoardOut)
goWest(BoardIn,BoardOut)
goNorth(BoardIn,BoardOut)
goSouth(BoardIn,BoardOut)
These four predicates take as input a Board configuration and produces the new Board configuration after the segment has been added to the input Board You should also write the following four predicates to process the four types of curves:
aCurve(N,Board,NewBoard)
bCurve(N,Board,NewBoard)
cCurve(N,Board,NewBoard)
hCurve(N,Board,NewBoard)
These predicates take two input parameters: N (size of the curve) and Board, the initial configuration, and return the NewBoard configuration after the curve has been processed.
Step 2:The second step is to produce two files containing the HTML and Javascript code to display the curves on a Web page. For this, you will need the following I/O predicates and atom concatenation predicate of SWI-Prolog:
open("f.html",write,Stream)
write(Stream,'Hello')
nl(Stream)
close(Stream)

atom_concat('a','b',X)
Make sure that you write these two files to your public_html directory on tinman so that
you can view these files on a Web browser.
The main predicate should be
hilbert(N)