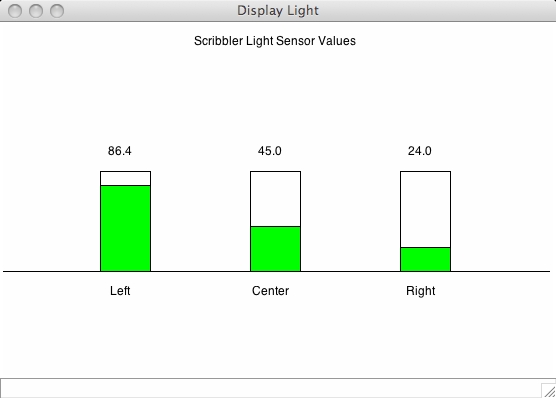
Write a Python program named DisplayLight.py that reads the three Scribbler light sensor values and displays their normalized form in a graphics window in a bar chart format. The sensor values should be sampled every 1 second and the main program should contain a while-True loop. Use the following normalize function:
Ambient = sum(getLight())/3.0

def normalize(v):
  if v > Ambient:
    v = Ambient
  return (1.0 - v/(1.0*Ambient))*100.00
A sample window is shown below:

Note: The Window should have a width of 550 pixels and a height of 350 pixels. The height of the bars should be 100 pixels (the maximum normalized value). The green part should be proportional to the normalized value of the sensor value.
Email your Art.py and DisplayLight.py files to raj@cs.gsu.edu by 11:59 p.m. on the assigned date.